- Part 1: Monitoring Cardano Stake Pool: Overview
- Part 2: Install and configure exporters
- Part 3: Install and configure Prometheus
- Part 4: Install and configure Graphana
- Part 5: Creating nice Cardano-specific Graphana dashboards
- Part 6: Last but not least: setting up firewall and domain name
- Part 7: Useful links, monitoring demo and follow-up articles
Introduction
Blockchain technology is changing fast. For networks like Cardano, it’s essential to make sure the stake pool works well and is safe. But what does this mean? Observing or “watching” a Cardano stake pool is crucial. It lets delegators see how the staking pool is doing right now. For those running the pool, it helps find and fix problems quickly. This keeps delegators’ trust and makes sure the Cardano network is strong.

So, why are certain tools better for observability? We picked Prometheus and Grafana. One main reason we chose Prometheus is because it works well with the cardano-node and Cardano node directly supports Prometheus’ way of storing data. Also, many people use Prometheus because it’s a trusted tool for monitoring and sending alerts. It’s known for being reliable, flexible, and easy to use. It has a simple way to search data and offers many options to view it. Grafana then takes this data and turns it into easy-to-read charts and graphs. Together, these tools make sure Cardano stake pools are watched closely and work well for everyone.
Monitoring architecture
The Cardano stake pool monitoring architecture provides a view of how each component interacts for effective observation. At its core, the Monitoring Server houses both Prometheus and Grafana, essential tools for data collection and visualization. Connected to this server are the Cardano Block Producer and two Relay Nodes, all equipped with cardano-node and node_exporter, ensuring a constant flow of data to the Monitoring Server.
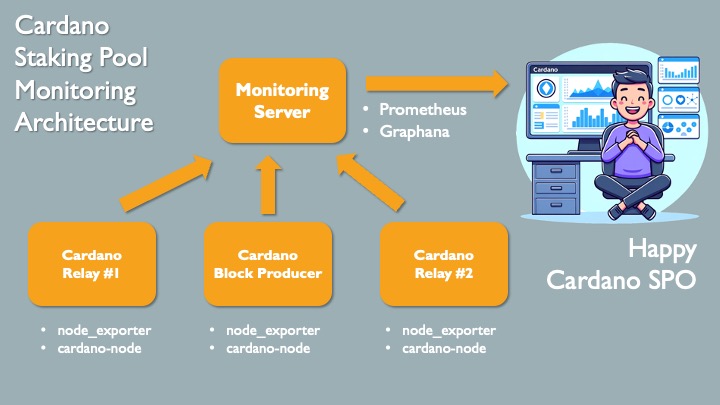
This streamlined setup allows users to access and view the Grafana dashboards conveniently from their computers. The user-friendly interface and real-time data representation enhance the experience, making it easier for stakeholders to understand the current state and performance of the Cardano stake pool. The end result? Well-informed, satisfied and confident delagators and Stake Pool Operator (SPO).
Prerequisites
For monitoring with Prometheus and Grafana, dedicated resources are advisable. At a minimum, ensure your server has 2GB of RAM and a 20GB SSD. For enhanced performance and to cater to increased data volumes, a configuration with 4GB of RAM and a 50GB SSD is recommended.
With these specifications in place, you’re poised to run a Cardano node efficiently and leverage the capabilities of Prometheus and Grafana for effective monitoring.
Conclusion
In this article, we talked about why it’s important to watch Cardano stake pool and the tools that help with this. We looked at the architecture and tools like Prometheus and Grafana, and what you need to make everything work well. If you want to learn more about how to keep an eye on your Cardano nodes, don’t miss the second part of our series: How to Install and Configure Exporters for Monitoring Your Cardano Nodes (in progress, to be published)
If you found this article insightful, follow us on Twitter for updates and join our Discord community for discussions. Support our work by delegating your ADA to our stake pool or buying our meme token BKV on bkvcoin.org.
The BKV Pool Team
Building a Stronger Cardano Network Together